Objective
Students will be able to:
- Create a graph representing a budget line and calculate the trade-offs of moving along the line.
- Represent a budget line using an equation in two variables.
- Predict transformations of the budget line given changes in income, changes in price of a good, or both.
- Calculate an equation for a budget line.
- Explain the meaning of the budget line in terms of personal finance.

In this personal finance lesson, students explore budget constraints by solving a contextual problem.
Resources
- Graphing & Interpreting Linear Relationships in the Context of Budgeting Presentation ppt File | pdf File
- Activity 1, Pat and Sam Hangout, one copy per student
- Activity 2, Trade-offs and Budget Constraints, one copy per pair of students
- Activity 1 Key and Activity 2 Key, one copy for the teacher
- Visual 1
Procedure
Budgets are an important part of personal finance and meeting financial goals. While a budget is a spending and saving plan, based on estimated income and expenses for an individual or an organization over a specific time period, budget constraints are limits. Goods are tangible objects and services are activities that people perform for us. Both satisfy economic wants. The prices of goods and services and the amount of personal income-(i.e., payments earned by households for selling or renting their productive resources which may include salaries, wages, interest and dividends)-limit spending and serve as constraints to budgets. This lesson considers a problem situation in which only two goods can be purchased with a given income. This simplified approach should enable students to extend the decision-making process to more complex (e.g., real-world) challenges virtually everyone faces. The budget line is represented using tables, graphs, and linear functions. Equations use constants and variables to represent relationships between quantities. Variables are symbols used to represent numbers. The impact of shifts in income and prices of goods can be analyzed by exploring transformations of the budget line that represent relationships between these quantities.
- Show Slide 1 and tell students they are going to explore the expenses involved in hanging out with friends.
- Show Slide 2 and ask:
- How much money might students your age have to spend? [Answers will vary.]
- How might students earn the money they have to spend? [Answers will vary, but may include allowance or money received from jobs.]
- What are some things students your age buy regularly with the money you have earned? [Answers will vary, but may include transportation, food, games, and other entertainment.]
- Tell the students that they will investigate the expenses involved with “hanging out” in a problem situation designed to model the relationship between income and prices of goods.
- Show Slide 3. Write the following terms on the board: income, budget, budget constraint, and trade-off. Ask the students to share words that could be used to define each term. List the words the students use on the board.
- Write the definitions below on the board (or use Slide 4) and circle any of the words used by the students in the definitions. For example, if the students used the term “salaries,” circle the word in the definition of income.
- Income: Payments earned by households for selling or renting their productive resources. May include salaries, wages, interest, and dividends.
- Budget: A spending-and-saving plan, based on estimated income and expenses for an individual or an organization, over a specific time period.
- Budget constraint: All the combinations of goods and services that a consumer may purchase, given current prices, and still be within his or her given income.
- Tradeoff: Giving up some of one thing to gain some of something else.
- Distribute a copy of Activity 1 to each student. Show Slide 5 and ask volunteers to read the slide. Ask students if they ever hang out with someone. [Answers will vary.]
- Show Slide 6. Tell students that Pat rides the bus using the stops in green. Ask students to complete number 1 on Activity 1.
- Explain that Pat must use a token to ride to Sam’s bus stop, then get off the bus and go to Sam’s house. Next, Pat and Sam return to the bus stop. They then each use a token to ride together to Freddy’s to have fries. Pat and Sam then must each use a token to ride to Sam’s bus stop. Pat walks with Sam to Sam’s house and returns to the nearest bus stop and rides the bus back home. Ask a student to come up to the slide and trace the route Pat rides to pick up Sam and go to Freddy’s. Note that some students may not know what a token is. Explain that a bus token is a prepaid coin similar to a prepaid bus pass. Ask students if they have suggestions for how Pat might ride the bus using fewer bus tokens. [Students will offer suggestions about how to ride the bus and use fewer bus tokens. Some students may say that Pat does not need to get off the bus, but that the two people can meet at Sam’s bus stop and Pat can just get on the bus. Explain that while they are first hanging out, the two want to ride together for the maximum amount of time.]
- Ask students to complete number 2 on Activity 1.
- Show Slide 7. Ask students what else they would need to know to find out how much Pat needs to spend in order to hang out with Sam? [Answers will vary. Students will likely say they need to know the price of a bus token and the price of the fries.]
- Ask students to complete number 3 on Activity 1.
- Show Slide 8. Ask students, “Now that you have more information, what will Pat spend on the bus for both Pat and Sam? What will Pat spend on fries if each gets an order of fries?” [Pat will spend 12 dollars on bus tokens and two dollars on fries.]
- Ask the students to share how they found their answers. [If six tokens are needed to hang out and each token is two dollars then you multiply six and two to get 12 dollars (i.e., Pat uses four tokens and Sam uses two). If an order of fries is one dollar and you want to buy two of them, you multiply two and one to get two dollars.]
- Show Slide 9. Tell students that the values at the bottom of the table represent the quantities of fries that Pat can buy for a hang out. The values on the left side of the table represent the quantities of bus tokens that Pat can buy for a hang out. Ask students how they can find the total amount that Pat needs for a particular combination. Select a combination such as four fries and 12 tokens and ask what calculation they can do. [One dollar times four plus two dollars times 12 for a total of 28.]
- Ask students where the total expense of 28 should go in the table. [Answers will vary. Go to the number 4 along the bottom row and identify the column associated with the expense for 4 fries. Identify the row with 12 bus tokens and see where the row intersects the column. This is the cell that represents the combination of 4 fries and 12 tokens.]
- Instruct students to complete the table in number 4 on Activity 1. (Note: this is a good place to split this lesson if you want to do it in two days. You can assign the table completion for homework.)
- Show Slide 10. Ask students what patterns they notice and what they noticed that helped them fill in the table quickly. [Answers will vary. Students may notice constant differences in rows (2) or columns (4). They may also notice diagonal differences are constant (6).] Point out that this table represents the amount Pat would spend on different combinations of fries and tokens.
- Ask students to answer number 5 a-c on Activity 1. Review answers using the Activity 1 Answer Key.
- Refer to Slide 10. Discuss:
- Which cells in the table show the number of fries and tokens you can buy for 32 dollars? Tell students to circle them. [Student answers will vary, but they will identify all the cells in the table with 32 in the cell.]
- Each of these cells shows us one combination of fries and tokens on which Pat could spend 32 dollars. How many different combinations are there? [Eight]
- How can you be sure there will not be other combinations as the number of fries and tokens increases? [Answers will vary. Students may share that since both quantities are increasing, the total amount spent must also increase.]
- Show Slide 11 to verify student answers. Tell students that now they will find an equation for all of the possible combinations.
- Show Slide 12. Put students into pairs. Give each pair a copy of Activity 2. Ask students to work with their partner and fill in the table in problem number 1 on Activity 2.
- Display Visual 1. When students complete this task, ask for volunteers to share their answers but be sure to write answers on Visual 1 in order so that patterns can be identified easily. Otherwise, show Slide 13 and ask what equation they could write if x is the number of fries Pat buys and y is the number of tokens and the total must be 32 dollars. [$1x+$2y=$32]
- Tell students they have now represented all of the possible combinations of fries and tokens Pat can buy with 32 dollars. Tell students this is an example of a budget constraint or all the combinations of goods and services that a consumer may purchase, given current prices, within his or her given income.
- Tell students they will now investigate how a graph can show all the possibilities if Pat wants to buy only bus tokens and fries with the 32 dollars. Point out to students that with an income of $32, Pat cannot buy all the fries and all the tokens that Pat may want. Pat must make a choice and when Pat determines how many fries and tokens to buy with 32 dollars, Pat makes a trade-off. Tell students that a trade-off is giving up some of one thing to gain some of something else. Ask students what trade-offs are made for the different combinations. For example, to go from 16 to 20 fries, Pat gains four fries, but what does Pat have to give up? [Two tokens] To gain six tokens, how many fries does Pat have to give up? [12.]
- Show Slide 14. Tell students to work with their partner to complete numbers 2-4 and the table in number 5 on Activity 2. Give the students 10 minutes to finish this task. Review answers using the Activity 2 Answer Key.
- Tell students they are going to represent Pat’s budget and constraints on that budget with a graph. Ask for volunteers to suggest points you need to plot on the graph. Ask students to plot the points on the graph in number 5 on Activity 2.
- Tell students they can represent the limit of Pat’s budget with a line. Points below the line represent quantities of fries and tokens Pat can buy. Ask students to draw the budget line in number 6 on Activity 2.
- Display slide 15 and ask students to check their graph for accuracy.
- Ask students to complete numbers 7-12 on Activity 2. Give students 10 minutes to complete this work.
- As the students are completing the activity, circulate and ask them to share their ideas about the addends in the equation and the meaning of points above, on, and below the budget constraint line. [Answers will vary, but students are expected to say that points above the line represent combinations that Pat’s budget will not allow and combinations below the line represent combinations Pat can afford. Addends (i.e., numbers added together) represent the total cost of fries and the total cost of bus tokens. Those points on the line represent combinations Pat can afford, but that will require Pat to spend all of the income.]
- Show Slide 16. Discuss:
- What is the equation of the line? [Answers will vary, but students should be able to see that the equation of the line is the same as the equation from the table they created namely 1x+2y=32.] Note that the goal is to build a link between the computations and the graph as a representation of Pat’s budget and its constraints for hang outs.
- What does 1x represent in the equation? [Money spent on fries is represented by 1x.]
- What does 2y represent in the equation? [Money spent on bus tokens is represented by 2y.]
- What does the point (6, 10) on your graph represent? [The point represents six fries and 10 bus tokens for a total cost of 26 dollars.]
- Can Pat purchase 10 fries and 10 bus tokens? How do you know? [Yes, since the point (10, 10) is below the budget constraint line.]
- Can Pat purchase 10 fries and 20 bus tokens? How do you know? [No, since the point (10, 20) is above the budget constraint line.]
- What do the points above the line represent? [Answers will vary. They represent combinations that Pat cannot purchase with his income.]
- Call the students back together and tell them that Pat just got some news. Show Slide 17. Ask students how this news will impact the budget constraint graph. Ask students to work with their partner to complete number 13 on Activity 2 and to create a new graph to represent the effect of the news. Give the students five minutes for this task.
- Call the students back together and ask what they found. [Answers will vary. They may say the line decreases at a faster rate than the original budget constraint line.]
- Show Slide 18 and ask students to explain the difference between the original line and the new line in terms of fries and bus tokens. [Answers will vary, but students should say that the new price of fries means that fewer bus tokens can be purchased for a given quantity of fries, so all the y values for the points will be lower than they were before the increase in the price of fries.]
- Ask students to complete number 14 on Activity 2.
- Show Slide 19 and ask the students how many times each month Pat can hang out with Sam if fries are two dollars and bus tokens are two dollars. [Answers will vary, but students should find a maximum number of two times. Each bus round trip for both costs $12. Thus, with an income of $32, only two round trips can be purchased.]
Review the key points of the lesson using the following questions:
- What is a budget? [A spending and saving plan based on estimated income and expenses for an individual or an organization, over a specific time period.]
- What is income? [Payments earned by households for selling or renting their productive resources. This may include salaries, wages, interest, and dividends.]
- When have you earned income? [Answers will vary but students should recognize that they have earned income when they have been paid for work that they have done.]
- What is a budget constraint? [All the combinations of goods and services that a consumer may purchase, given current prices, within his or her given income.]
- What is a trade-off? [Giving up some of one thing to get some of something else.]
- Given the budget constraint line has the equation 32 = 1x + 2y, x is the number of fries Pat can buy, and y is the number of tokens, what is the meaning of 32 in the equation? [32 is Pat’s total income.]
- Given the budget constraint line has the equation 32 = 1x + 2y, x is the number of fries Pat can buy, and y is the number of tokens, what is the meaning of 2 in the equation? [$2 is the price of a token.]
- Given the budget constraint line has the equation 32 = 1x + 2y, x is the number of fries Pat can buy, and y is the number of tokens, what is the meaning of 1x in the equation? [$1 is the price of an order of fries and x is the number of order of fries. So 1x is the total amount Pat can spend on fries.]
- Explain how to find the equation for a budget constraint line if you know that your total income is $20 and you can purchase soda and hotdogs. The price of each soda is $2.00 and the price of each hotdog is $4.00. [First decide whether the number of sodas or hotdogs will be x. Second write your equation using the following approach: if the number of sodas is represented by x, then the number of hotdogs will be represented by y. The price of soda is $2 and 2x represents the amount spent on sodas. The price of a hotdog is $4 and 4y is the amount spent on hotdogs. So the total amount spent on hotdogs and soda is 2x + 4y = 20.]
- Explain how to create the graph for the budget constraint line if you know that the total income is $20, the price of each soda is $2.00 and the price of each hotdog is $4.00. [First find the number of sodas you could purchase if you bought no hotdogs. Second, find the number of hotdogs you could purchase if you bought no sodas. Third, putting the number of sodas on the x axis, plot the point (10, 0) representing 10 sodas and 0 hotdogs. All your money is spent on soda. Fourth, putting the number of hotdogs on the y-axis, plot the point (0, 5), representing zero sodas and five hotdogs. All your money is spent on hotdogs. Now draw the segment between the two points. This is the budget line that represents the limit for your income.]
- How can we represent the relationship between income and prices of goods? [This relationship can be represented by a line called the budget constraint line.]
Assessment
- Bill has $10 dollars to spend on chips and soda. If the price of chips is $1 and the price of a soda is $2, which equation represents the relationship between Bill’s income and the quantity of chips (x) and soda (y) he can purchase with his money?
- 10 = 2x + 1y
- [10 = 1x + 2y]
- 10 = x + y
- 10 = ½ x + y
- Bill has $10 dollars to spend on chips and soda. If the price of chips is $1 and the price of a soda is $2, which graph represents the relationship between Bill’s income and the quantity of chips (x) and soda (y) he can purchase with his money?
a. 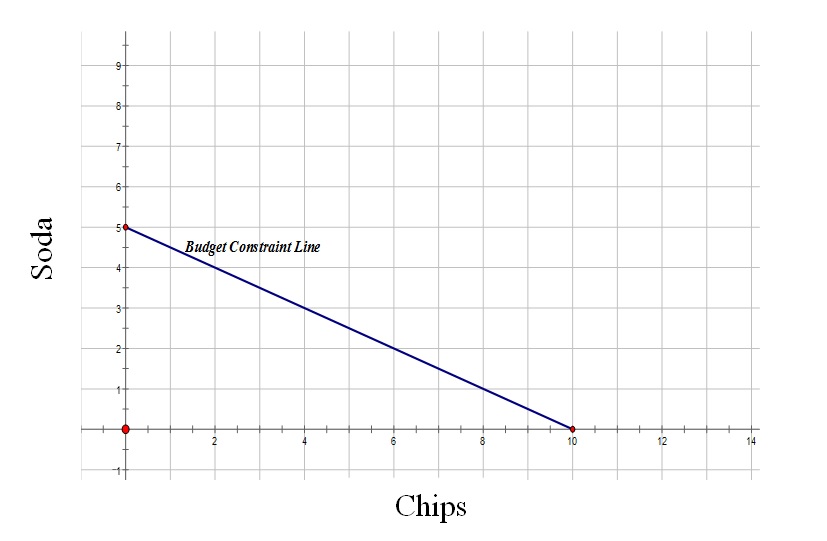
b. 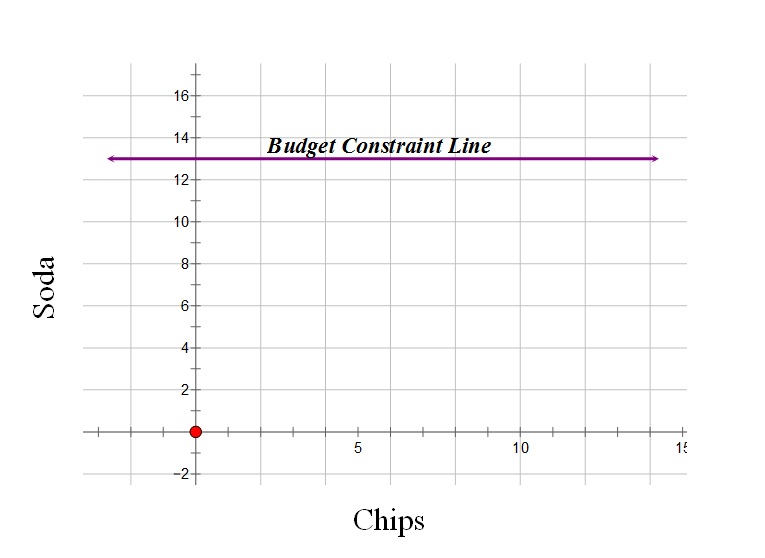
c. 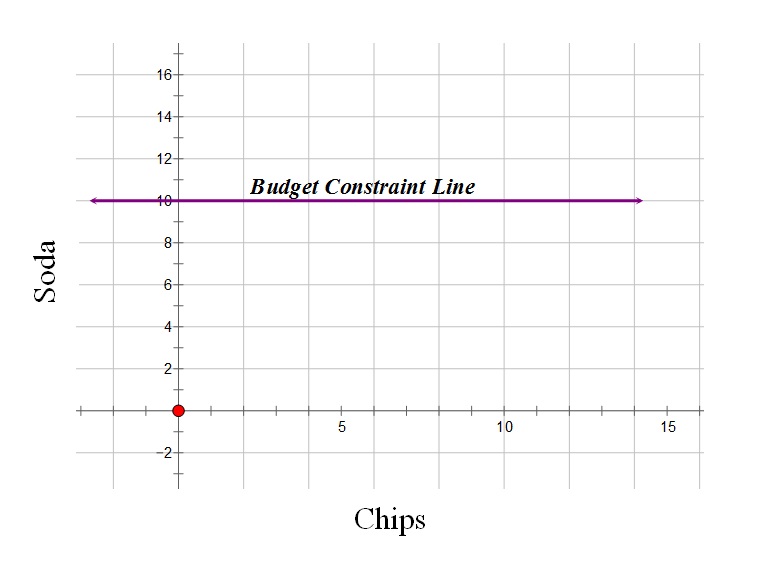
d. 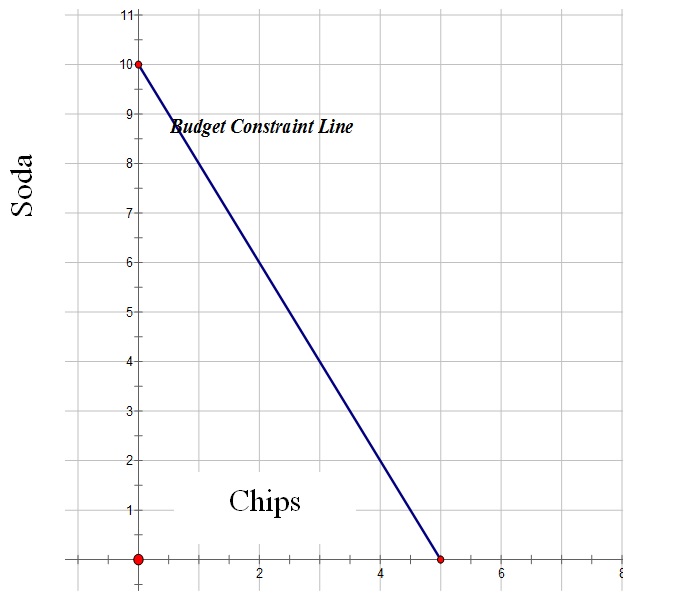
[Answer: a.]
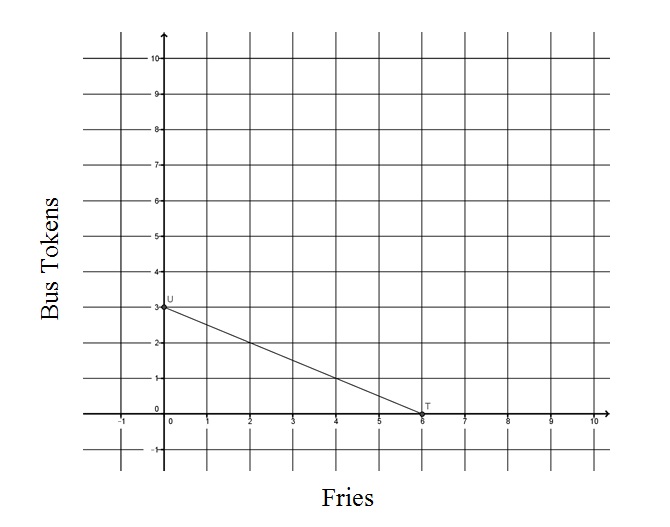
- Create a graph of the budget constraint line if Pat’s income is 12 dollars, bus tokens are four dollars, and fries are two dollars.
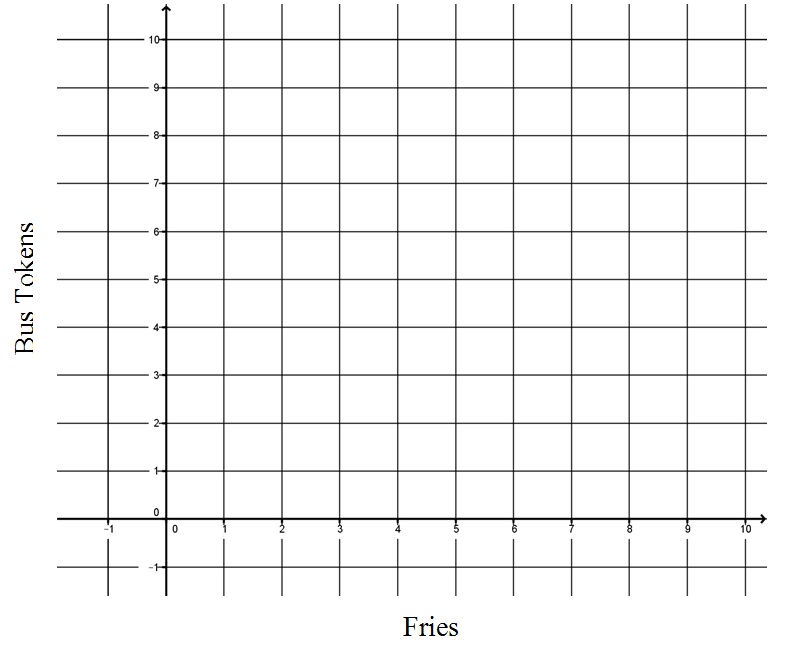
Answer: