
 Sign in with Google
 Fill ‘er up, Please
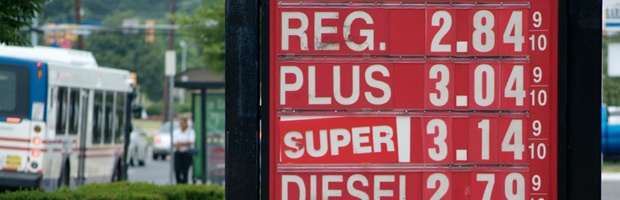
Americans drive more than 2.6 trillion miles per year, that’s 14,000 round trips to the sun! And for the most part, these vehicles are all running on gasoline. For many of us, we watch the price of gas as closely as the price of a gallon of milk, or the price of a movie ticket. This activity provides the students an opportunity to learn how gas prices are created and what are the components of the final price.
Introduction
 Ask the students the following question. What travels the distance of 14,000 round trips to the sun per year? Answer: American vehicles! Yep! No kidding. We drive more than 2.6 trillion miles per year in cars, trucks and SUVs. In our personal vehicles we fill up 115 billion gallons–yes, that's with a "B" — of gasoline and diesel fuel PER YEAR.
 We all watch the prices at the local pumps as closely as the price of a gallon of milk, a loaf of bread or a Whopper sandwich, yet statistics report that our average fuel economy of cars and light trucks is at the lowest level since 1980! Well, just how did that happen? Before starting the lesson, have the students watch several gas stations and record gas prices on a daily basis. If the students can carry out this introductory activity after a weekend or a holiday, so much the better because students then will likely record price jumps.
Learning Objectives
- Explain why gasoline prices fluctuate according to the demand and supply (market mechanism.)
- Explain how the price of the resource influences consumer purchases of vehicles.
- Identify the components that influence the price of a gallon of gasoline.
- Predict the most likely consumer behavior based on the approximate cost of a gallon of fuel in a particular country.
Resource List
-
How Stuff Works: How Gas Prices Work: This site explains why the price of gasoline goes up and down.
https://auto.howstuffworks.com/fuel-efficiency/fuel-consumption/gas-price.htm
-
Department of Energy:This is the U.S. Government's Department of Energy site.
https://www.energy.gov/
-
Department of Energy: Oil Refineries: This page of the site informs the reader more about oil refineries.
www.eia.doe.gov/oiaf/servicerpt/refinery.html
-
Bureau of Transportation Statistics: This site contains transportation data.
https://www.bts.gov/
-
Student Research Log: Students will use this worksheet to record information as they work through the lesson.
Student Research Log
Answers to Student Research Log
-
Historical Gas Prices: This chart shows gas prices from 1950 to 2001unadjusted and adjusted for inflation.
Chart
-
Pricing Gasoline & Oil Production: this site provides information on gasoline prices and oil production and has some great explanatory graphics.
www.wtrg.com/prices.htm
Process
The purpose of this lesson is for each student, individually or with a partner, to initiate the research process, record their findings, and utilize their findings to create a chart, a graph or other answer to one of the "Think About it" questions. Tell the students to feel free to explore the other web links to improve their understanding of the process of getting oil from the ground to their gas tank.
-
Read the article: https://auto.howstuffworks.com/fuel-efficiency/fuel-consumption/gas-price.htm Print the article for easy reference and include it in your Student Research Log.
Use the U.S. Department of Energy Oil Refineries to learn more about the production of today's oil refineries.
-
Tell the students to print and use the following chart to compare gas prices over a fifty year span. Remember to use the X axis for years, and the Y axis for price.
-
Ask to the student to think about and answer the following questions: View Interactive Activity
-
What happened in the 1970s to gasoline prices and why?
[They rose substantially. Difficult to point to a singular reason. Although certain events which impacted the price were the Arab-Oil Embargo of 1973, Inflation of the money supply through the late 60's, 70's and early 80's and the general uncertainty about future oil supplies and demand.]
-
What has happened to the real price of gasoline?
[Save for the late 70's and early 80's, the price has remained somewhat steady and even fallen somewhat into 2001.]
-
What effect would that change have on purchases of automobiles?
[Purchases of automobiles and especially larger sized ones have increased after falling in the early 1980's.]

-
What signal did this send to consumers?
[That the relative abundance of gasoline was increasing as each marginal unit of gasoline was cheaper therefore they used more gasoline.]
-
How did consumers react in their choices of vehicles?
[Cars got bigger and used more gasoline.]
-
What happened in the 1970s to gasoline prices and why?
-
After the students have read the article "How Gas Prices Work" – have them go back to their Student Research Log and answer the following questions:
-
Hong Kong and Seoul, South Korea are relatively near Indonesia. Why is there such a large per-gallon difference in prices?
[The cost-of-living in Hong Kong is much higher than that of South Korea.]
-
What generalization could be made about the countries with the least expensive price for a gallon of gasoline?
[The government subsidies the low price or the country is a chief exporter/small consumer.]
-
What generalization could be made about the countries with the most expensive price for a gallon of gasoline?
[Strict enviromental regulation, taxation and heavy consumption.]
-
Hong Kong and Seoul, South Korea are relatively near Indonesia. Why is there such a large per-gallon difference in prices?
Conclusion
 Here are two mysteries for the students to solve:
- If the United States is the second largest producer of oil in the world, why are we importing so much petroleum?
- In petroleum markets, if you want to make more money, you sell more barrels of oil. Is this statement true or false? Prepare a short explanation defending your position.
Extension Activity
The science teacher in your school might be interested in the work your students have done for this lesson. She or he might also be interested in knowing about some of the web sites.
Bureau of Transportation statistics contain household budgets. If students use the excel spreadsheets they can compute what percentage of average household income is allocated to gasoline. Dollar values are provided, but if the student enters =b16/b6, the cell returns percentages. In the case of the average household, 3% of annual income flows to the gas pump. Students could then carry that standard back to the department of energy’s gas mileage link and compare the cost of fueling a new vehicle of their choice.
"Pricing Gasoline & Oil Production"
Access this site to see explanatory graphics on gasoline prices and oil production.
Assessment
Use one of the following questions to evaluate students' syntheses of their research:
- What happened in the 1970's to prices and why?
- What has happened to the real price of gasoline?
- What effect would that change have on purchases of automobiles?
- What signal did this send to consumers?
-
How did consumers react in their choices of vehicles?
 Have the students answer the following questions:
- Hong Kong and Seoul, South Korea are relatively near Indonesia. Why is there such a large per gallon difference in prices?
- What generalization could be made about the countries with the least expensive price for a gallon of gasoline?
- What generalization could be made about the countries with the most expensive price for a gallon of gasoline?