Grades 9-12
Don't have an account yet? Sign up for free
The student will be able to accurately illustrate changes in monetary policy by adjusting limited and ample reserve curves accordingly.
PPT slides
Graph sheet
Graph Scenarios with Answers
Example of graph sheet with yarn pieces
Example of completed graph activity
Lesson Plan – sections to be used as needed
Warm Up
Review limited and ample reserve terms and key points with students. This information is located in the Slideshow. Answer the discussion question: What is the main difference between ample and limited monetary policy, and how does each approach reflect the economy? A sentence starter is provided in the Slideshow as a scaffolding tool for students who may need extra assistance.
Modeling
Continue through the short lecture slides on the differences and characteristics of ample vs limited monetary policy.
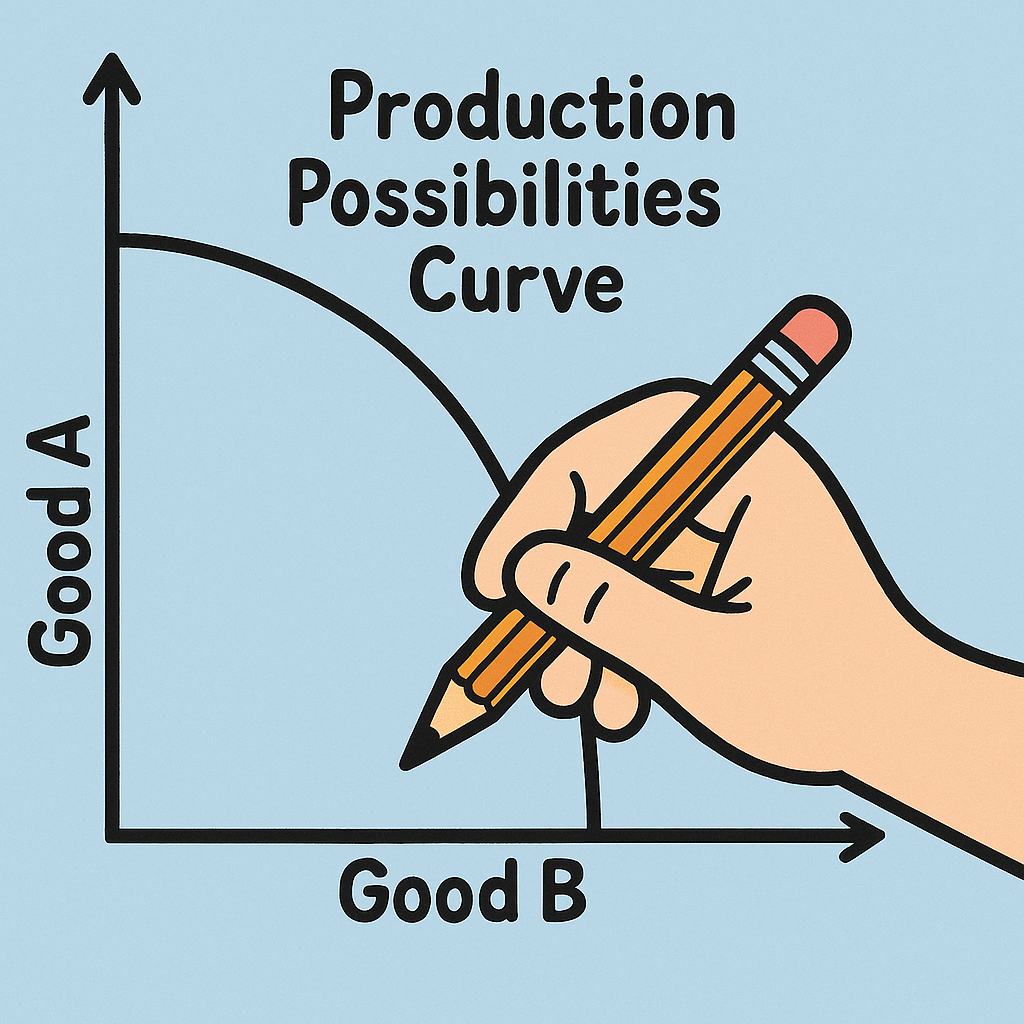
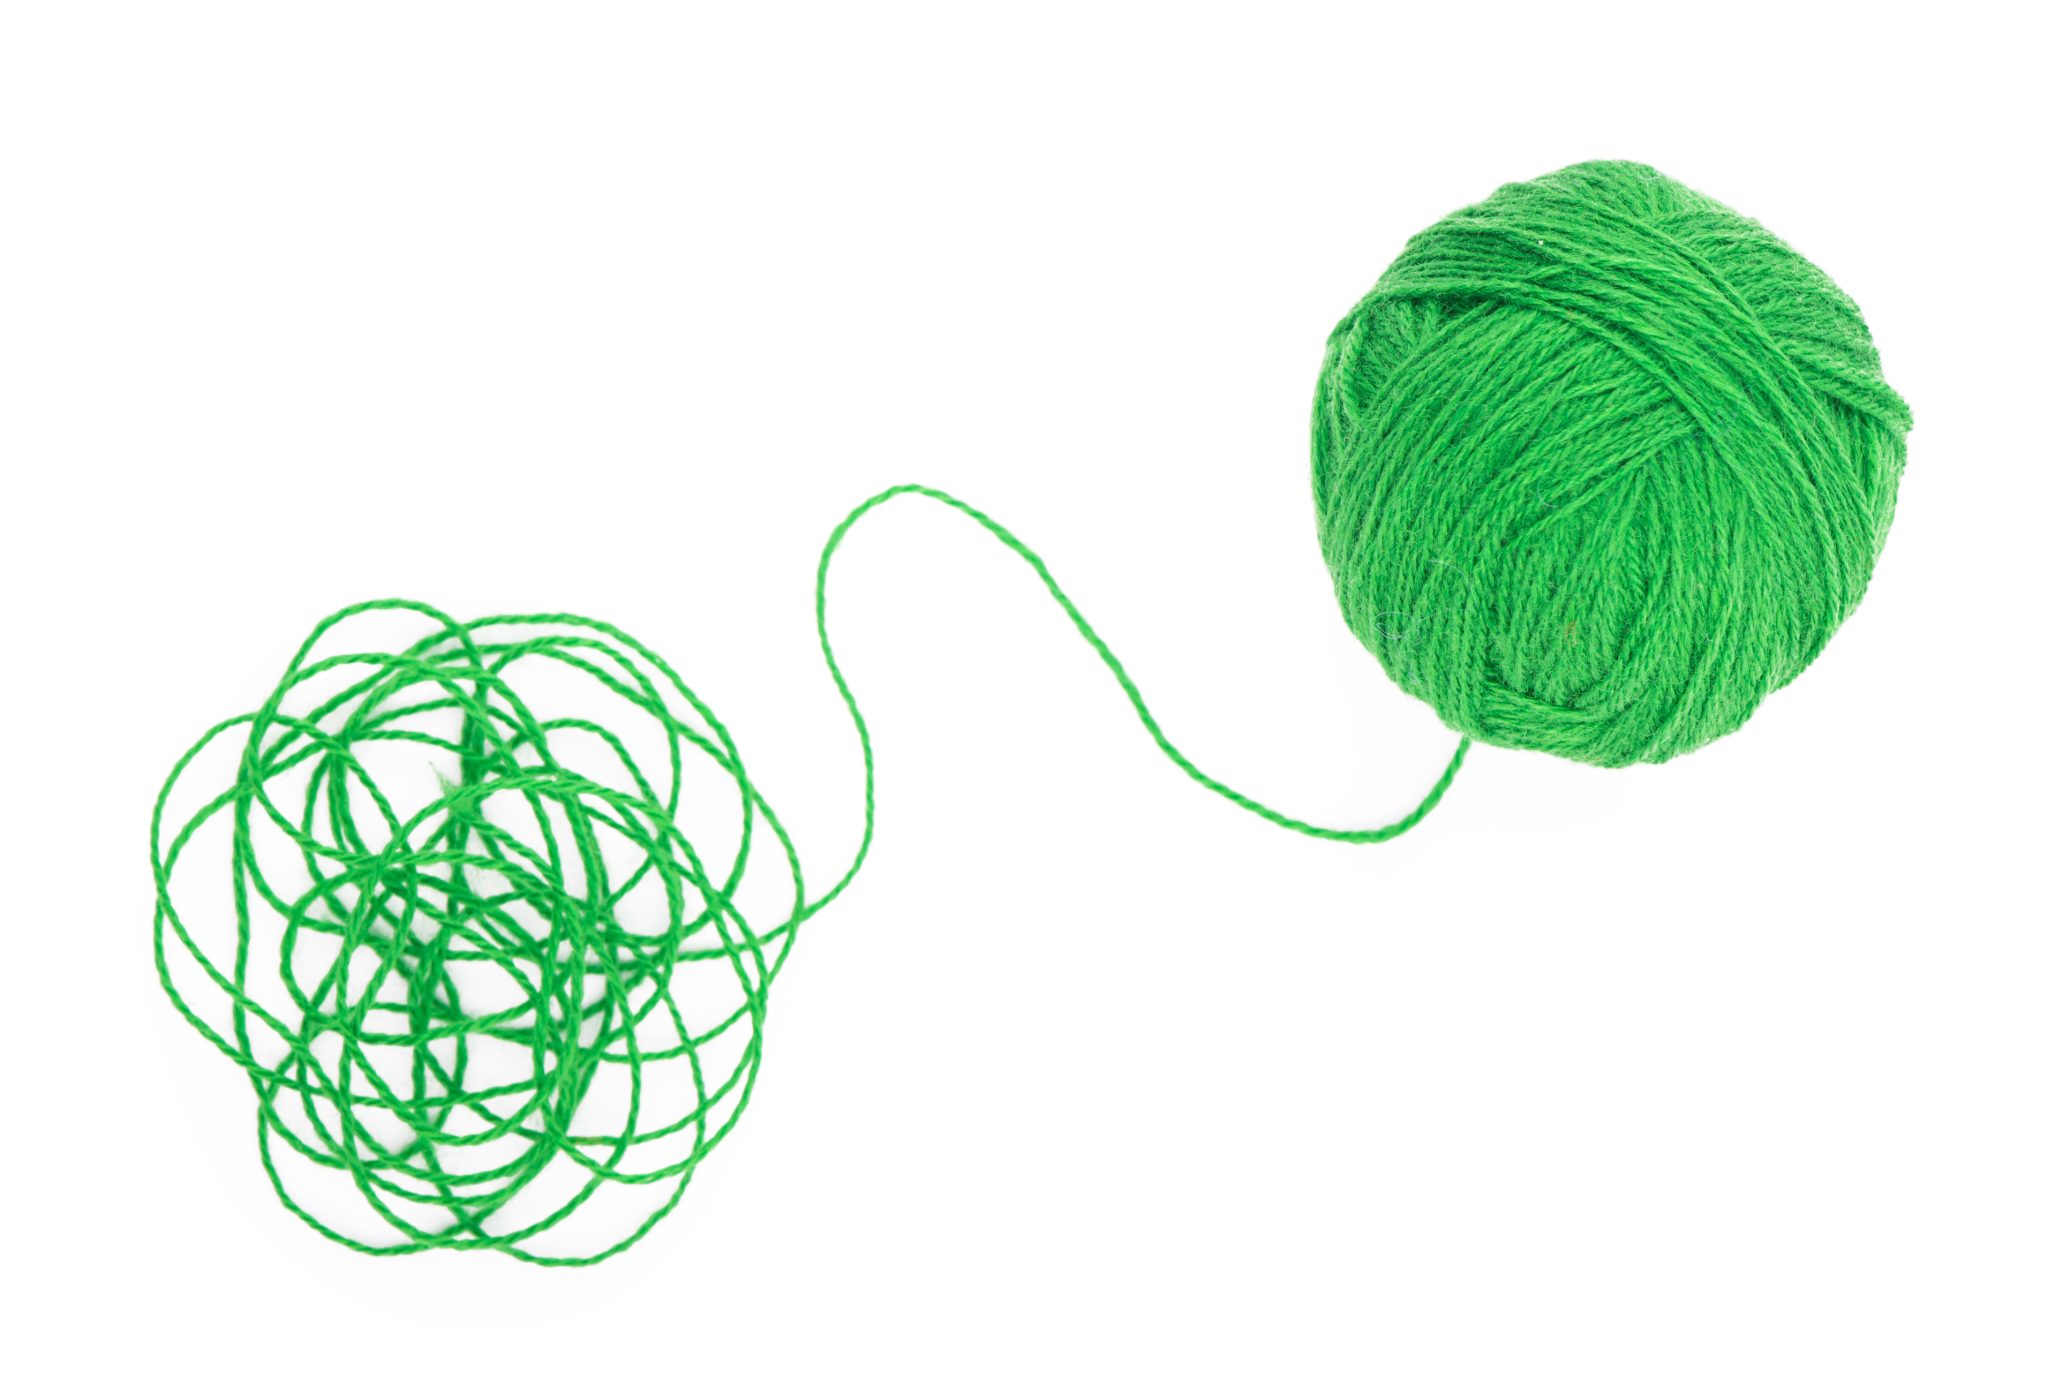
After finishing the lecture slides, begin to explain and demonstrate the procedure for the “string graphs.” 1. Distribute one laminated graph, two blue pieces of yarn, and one red piece of yarn to each student or pair of students. 2. Explain that the teacher will read a scenario. Based on that scenario each student will place the appropriate color yarn where the new line would be located on each graph.
Activity
As the students are placing their yarn on the graph, the teacher will circulate around the room answering questions and assess student understanding. After all of the students have placed their yarn on their graph, the teacher will read the scenario again and ask the class in which direction the line moved. After verifying the correct answer, the teacher will ask why that line moved? This process will be repeated with other scenarios.
Assessment:
After class discussion of all of the string graph scenarios, students will complete the Quizzizz Monetary Policy: Limited vs Ample for individual practice/assessment.
Extension:
Fiscal, Limited Monetary, & Ample Monetary Policies Quizzizz
As a conclusion, you could have the students write their own prompt and draw the corresponding graph.

Grades 9-12

Grades 9-12

Grades 9-12

Grades 3-5