Grade 3-5, 6-8
,
Lesson

The Mystery of the Amazing Farmers

Updated: January 14 2021,

In this lesson you will be taking on the role of an an investigative reporter to solve the Amazing Farmer Mystery. The goal will be to use seven clues provided throughout the lesson in order to figure out how so few farmers can produce enough food and fiber for the nation.

Introduction

Pose the following questions and discuss the answers your students provide:

  • How many US workers today are farmers?
  • Do you live on a farm?
  • Did your parents or grandparents live on a farm?

Learning Objectives

  • Identify that when workers learn and practice new skills they are improving their human capital.barn
  • Recognize that workers can improve their productivity by improving their human capital.
  • Explain that when workers can improve their productivity by using physical capital such as tools and machinery.
  • Explain that technology can improve productivity.
  • Recognize that improving productivity can raise future standards of living.
  • Explain that workers can improve their productivity by using physical
    capital such as tools and machinery.

Resource List

Process

View Interactive Activity

The numbers show a big change in the agricultural workforce.

  • 200 years ago, 90% of the population farmed.
  • Today less than 2% of the population farms.

What might explain this change? How can so few farmers produce enough food and fiber for so many people?

tractor
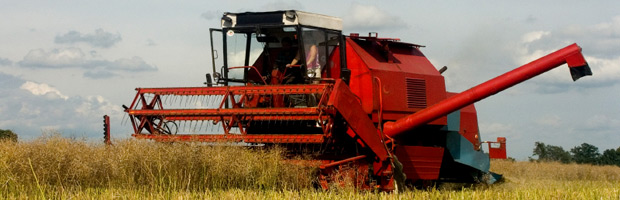
Explain to the students that they will be taking on the role of an investigative reporter to solve the Mystery of the Amazing Farmer.
The goal will be to use seven clues provided throughout the lesson in order to figure out how so few farmers can produce enough food and fiber for the nation. [General answer: Each farmer today is producing more than farmers did in the past.]


clueClue #1

In using this clue, students will focus on increases in farmers’ capacity to supply food. To describe the increased capacity, students will answer a series of questions and create a graph to display the data.

View Interactive Activity

  1. In 1930, how many people could one farmer supply?[9.8.]
  2. In 1950, how many people could one farmer supply? [15.5.]
  3. In 1960, how many people could one farmer supply? [25.8.]
  4. In 1970, how many people could one farmer supply? [75.8.]

Emphasize how amazing these numbers are.

Have the students graph this data using the following interactive graphing activity.

Once the students have completed the activity they will have the option to print their graph. If you would like to have a hard copy of their work, have them print their results and turn them in.

Isn’t it amazing that one farmer can supply food and fiber for over 75 people?

Explain to the students that when each farmer can supply more people per year, this is an increase in productivity.

Have the students respond to the following mystery.

Mystery

  • Why can a farmer today produce so much more than farmers 100 years ago?
  • Were the farmers in 1900 lazy? Are farmers today more hardworking people?
  • How did this increase in productivity happen?
clueClue #2

In using this clue, students will do research at two web sites to find out about investments that have increased the productivity of farmers.

Economists tell us that investment in factories, machinery, new technology, and in the health, education, and training of people can increase productivity. That is, the output per worker can increase.

Have the students visit the following two web sites to look for investments that might have increased the productivity of farmers.
They can record their results on this printable copy of the chart below: Labor Hours chart.

The students should look especially for real capital (tools, factories, equipment) improvements that have affected the production of wheat; they also should look for improvements in technology and human capital that might have affected the production of wheat and other products.

Year Labor hours
to produce
100 bushels of
wheat
Examples of improvements in real capital (factories, tools, equipment) technology (know-how) or human capital (improved knowledge and skills of workers)
that may have improved productivity.
Real capital Technology Human capital
1820*
1830
1849*
1862*
1870
1890
1930
1941*
1955
1965
1975
1980*
1987

For information on output and real capital: https://www.thoughtco.com/history-of-american-agriculture-farm-machinery-4074385 .
*For information on human capital and technology: https://www.thoughtco.com/history-of-american-agriculture-farm-machinery-4074385 .

[Human capital examples: Learning to use each new tool represented an improvement in human capital; 1820 colleges offer agriculture courses; 1941 extension agents in every rural area (extension agents educate farmers.

Technological improvement examples: 1849, chemical fertilizers widely available; 1862, horse power replaces human power; 1980, no-till or low-till farming to reduce erosion, development of hybrids.]

Real capital improvement examples:
1830, About 250-300 labor-hours required to produce 100 bushels (5 acres) of wheat with walking plow.

1890, 40-50 labor-hours required to produce 100 bushels (5 acres) of wheat with gang plow, seeder, harrow, binder, thresher, wagons, and horses.

1930, 15-20 labor-hours required to produce 100 bushels (5 acres) of wheat with 3-bottom gang plow, tractor, 10-foot tandem disk, harrow, 12-foot combine, and trucks.

1955, 6-12 labor-hours required to produce 100 bushels (4 acres) of wheat with tractor, 10-foot plow, 12-foot role weeder, harrow, 14-foot drill and self-propelled combine, and trucks.

1965, 5 labor-hours required to produce 100 bushels (3 1/3 acres) of wheat with tractor, 12-foot plow, 14-foot drill, 14-foot self-propelled combine, and trucks.

1975, 3-3/4 labor-hours required to produce 100 bushels (3 acres) of wheat with tractor, 30-foot sweep disk, 27-foot drill, 22-foot self-propelled combine, and trucks.

1987, 3 labor-hours required to produce 100 bushels (3 acres) of wheat with tractor, 35-foot sweep disk, 30-foot drill, 25-foot self-propelled combine, and trucks]

clueClue #3

plowIn using this clue, students will analyze their research from the previous clue and identify the improvements as either real capital, human capital, or technology.

More output per hour of labor is an improvement in productivity.
Have the students use the information in the chart they have completed to answer the following questions:

  • Was there an improvement in the output of wheat per hour? (Were farmers able to grow 100 bushels of wheat in less time each year?)
  • What made farmers more productive?

Discuss the findings from the students’ research. Ask the students if they found examples of improvements in real capital, human capital, and technology that may have contributed to this increase in productivity.

These are some of the examples the students may have found:

  • walking plow
  • gang plow
  • seeder
  • horses
  • tractor
  • trucks
  • 30-foot sweep disk
  • 4-row harvester
  • 5-bottom plow
  • learning to use each new tool
  • colleges offer agriculture courses
  • extension agents in every rural area
  • chemical fertilizers widely available
  • horse power replaces human power
  • mechanical power replaces horse power

Have the students complete the following interactive activity to see if they can determine which of the examples are real capital, which are human capital, and which represent technology?

Drag and Drop Interactive Activity

Once the students have completed the activity they will have the option to print their graphs. If you would like to have a hard copy of their work, have them print their results and turn them in.

clueClue #4

In using this clue, the students will learn how to calculate productivity.

See if the students can determine how we measure productivity. Using the formula below, have them take the following short answer quiz.

View Interactive Activity

equation

In 1830 it took 250-300 labor-hours to produce 100 bushels of wheat.
In 1987 it took 3 labor-hours to produce 100 bushels of wheat.

What was the output per hour of labor in 1830
equation[.4 bushels per hour]

What was the output per hour of labor in 1987
(round your answer to the whole number)
equation[33 bushels per hour]

clueClue #5

girl farmerHigher farm productivity has led to lower labor costs. Lower labor costs can lead to lower prices for consumers–an improvement in their standard of living.

In using this clue, the students will answer a series of questions in order to learn how improvements in productivity affect cost of production.

Have them answer the following questions. Farmer A and Farmer B are both corn producers. Determine which one produces more corn and which produces corn at a cheaper cost with the following quiz

View Interactive Activity

clueClue #6

In using this clue, the students will learn how displaying information graphically can give a better overall picture of what is happening.

A picture is worth many words.

Start by having the students draw a pie chart entitled “Farm and non-Farm employment in the US in 1990,” Alternatively, you may have them use the web sites listed below to generate the graphs.

If the students create a pie graph using the web site, they should follow these steps:

Ask the students which method of graphing is faster, drawing a graph or using technology to draw a graph.
In addition, you may want the students to draw another graph showing the same statistics for 1799.

Now ask the students to make a graph to show what has happened to the number of farmers since 1799. Again, you can have students create a graph on paper or use the web site listed. Below are the two choices.

Choice A
You may print the chart and draw a graph with one line for the population and another line for the percentage of the labor force occupied in farming.

Choice B
You may go to https://nces.ed.gov/nceskids/createagraph/ , enter the data and the computer will generate a chart for you.

Point out that computers can increase productivity by helping us do work faster.

Graph Information

  • You will be making a line chart with 10 points.
  • Add the following data to make a line graph that shows the percentage of the labor force occupied in farming from 1799 to 1990
  • Label the “Y” axis “Percentage of the labor force in farming.”
  • Label the “X” axis “Year.” (If your students are doing this using the web site, note that this column will only accept numbers up to 1000; thus they will need to leave the final zero off the year. They can add it by hand later if they print the chart.)
  • Data:
    • 1776-1799: 90%
    • 1840: 69%
    • 1860: 58%
    • 1880: 49%
    • 1900: 38%
    • 1920: 27%
    • 1940: 18%
    • 1960: 8.3%
    • 1980: 3.4%
    • 1990: 2.6%

Again, talk with your students about how the information can have more of an impact by displaying it in graphical form.

clueClue #7.

farmerIn using this clue, discuss what happens when fewer farmers are needed to produce a given amount of food. Emphasize the point that this opens the door for people to pursue different careers; also emphasize the effect on our standard of living.

When fewer farmers can produce the food and fiber the nation needs, many people can leave farms and produce other goods and services that consumers may want. With modern capital, advanced technology, and skilled labor, 2.6% of the labor force can produce an ample supply of food and fiber for the nation. This means that 97% of the labor force can specialize in other work.

Check this https://www.bls.gov/k12/ site for some of the other careers that you could choose today.

Because farmers are so productive, the other 97% of the labor force can produce millions of other goods and services that consumers want. You can go to this https://www.bls.gov/iag/ site to see some of the other industries where people work.

Thus, improvements in farm productivity have allowed many people to do other, non-farm work that they may like better. As a result, many additional goods and services can be produced. How do you think this development will affect the nation’s standard of living?

clueCan you solve the mystery?

Based on the clues provided in the

View Interactive Activity

4, students will need to name three types of improvements that have brought about the large increase in agricultural productivity.

  1. R _ _ _ C_ _ _ _ _ [Real Capital]
  2. H_ _ _ _ _ C_ _ _ _ _ _ [Human Capital]
  3. T_ _ _ _ _ _ _ _ _ _ [Technology]

This is not the end of the story. Farmers continue to become more efficient. Check this site. How might the information it presents help a farmer to be more productive?
Online Farmer

Extension Activity

Ask students: What do you know about farming in your state? Have them go to the National Agriculture Statistics Service site to see what the top two agricultural products in their state are.

Also, direct the students to check out this timeline of the history of agriculture in the United States.

Subjects:
Business,Economics,ELA