Grades 3-5
Nearpod version available
Who Bears the Burden When a Tax Is Imposed on a Good?
Objective
Students will be able to:
- Determine the value of a function when given the x value.
- Apply mathematical knowledge of functions to an economic example.
- Determine the value of a function at a given x value from a graph.
- Determine the area under straight line graphs.
- Determine the dead weight loss as well as the portion of tax paid by the producer and consumer using different graphs.
- Determine whether a given event causes a shift in supply or demand.
Concepts
In this personal finance lesson, students will learn how to determine the function values of simple functions.
Resources
- Activity 1: Calculate Function Values – one copy per student
- Activity 2: Calculate Areas – one copy per student
- Activity 3: Calculate Prices and Quantities – one copy per student
- Activity 4: Supply and Demand Cards – copied and cut apart to provide one set per student. Each set should include: A-light green, B-dark green, C-light blue, D-dark blue, E-white, F-yellow, G-pink, H-orange. (Note: if different colors are used, the assessment must be changed to match. If you do not have colored paper, refer to the letters in the upper left corner of each card.)
- Activity 5: Taxation and Dead Weight Loss and Tax Incidence – one copy per student
- Supply and Demand, powerpoint | pdf file
- Video: Taxation and Dead Weight Loss. The effect of taxation on the equilibrium price and quantity video available at https://www.khanacademy.org/economics-finance-domain/microeconomics/consumer-producer-surplus/deadweight-loss-tutorial/v/taxation-and-dead-weight-loss
- Interactive slides to investigate the relative amounts of tax paid by the producer and consumer available at express.smarttech.com/# and https://www.stlouisfed.org/education/tax-incidence
Procedure
A government may tax a good or service in order to generate revenue. This will result in smaller producer and consumer surpluses and in dead weight loss. The tax burden is carried by the producer and consumer and can be calculated using different areas on the supply-demand graph for the good or service.
Mathematical straight line functions are used to calculate the corresponding price(s), (the y-value), asked and/or paid for a given quantity of a product, (the x-value). Equations to calculate the areas of rectangles and triangles are used to calculate different areas on the supply-demand graph.
- Use structured practice to explain how to calculate the y-value in a simple equation as follows:
- Write a simple equation such as y = 2x + 4 on the board.
- Write the following steps on the board, explaining the method.
- Step 1: substitute x with 3 in the equation. [y = 2(3) + 4]
- Step 2: calculate the value of y. [y = 6 + 4 = 10]
[Answers may vary if a different equation and/or different values of x are used.]
- Distribute a copy of Activity 1: Calculate Function Values to each student. Ask students to study the information on mapping in number 1.
- Divide the students into pairs and ask them to use the given example to answer number 2a-2c on Activity 1. Review answers.
- The given “rule” comprises of how many numbers? [The rule or equation is comprised of two numbers represented by x and y.]
- How will you use the “rule” to calculate one number if another is given? [One of the numbers can be calculated by substituting a value for the other number in the equation and doing the necessary calculations.]
- Explain the meaning of “correspondence between two numbers” in your own words. [Correspondence between two numbers means that for every value of x (or y) a value for the other number y (or x) may be calculated.]
- Use guided practice in number 3, Activity 1, to allow students to practice calculating the y-value of an equation. Ask students to consider the equation: 4x – 3 = y. Ask, “If x = 1, could the value of y possibly be 7?” [Y cannot be 7: y = 4 (1) – 3 = 4-3 = 1]
- Ask students to calculate the value of y in each example and complete the table in number 4 of Activity 1. After students have had time to work, draw the table on the board and with student input, complete the table, explaining the process in all three cases. Allow each student to mark and/or correct his/her own answers.
|
x |
y |
4x – 3 = y |
Possible questions and answers |
1 |
0 |
-3 |
4(0) – 3 = 0-3 = – 3 |
Why is 4(0) = 0?
Multiplying by 0 always give 0
|
2 |
-1 |
-7 |
4(-1) – 3 = -4 – 3 = -7 |
Why is 4(-1) = -4?
Multiplying a negative number by a positive number always gives a negative answer. Why is -4-3 = -7? Adding 2 negative numbers will always give a negative answer. |
3 |
3 |
9 |
4(3) – 3 = 12 – 3 = 9 |
- Ask students to study the examples in number 5a and 5b in Activity 1.
- Allow students to practice calculating the y-value in 6a and 6b either individually or in pairs. Ask two students to do the calculations on the board while the rest of the class identifies possible mistakes or evaluates the answers.
a. f(x) = 2/3(x) – 4 if x = 9
= 2/3(9) – 4
= 6 -4
= 2
b. 3y – 8x = 10 if x = – 2
3y – 8( -2) = 10
3y + 16 = 10
3y = 10 -16
y = -6/3
= – 2
- Write the following formulas used to calculate area on the board:
Area of a Square: | X |
Area of a Rectangle: L X w
Area of a Triangle: (1/2)b + h
Area of a Circle: A=π(r)2; r is the radius
- Distribute Activity 2. Calculate Areas, one copy per student. Ask students to only calculate the areas of a triangle and rectangle in this lesson. Instruct students to use the appropriate formula to complete Activity 2. Review student work.
1. Area L X w
= 4 x 2.5
= 10
2. Area =(1/2)b x h
= ½ x 12 x 6
= 36
- Use Slides 1-7 to review demand, determinants of demand, supply, and determinants of supply.
- Distribute Activity 3, one copy per student. Display Slides 2 and 3 on demand and supply again, write the two equations on the board, and ask students to identify the differences and similarities. [Similarities: both give the relationship between the price and the quantity. Differences: in the demand equation –b is used and in the supply equation + b is used.]
- Use guided practice to allow students individually to calculate the prices and quantities in numbers 1 and 2 of Activity 3. Ask students to share their answers and explain their reasoning.
1. P = 5 – 2Q
P = 5- 2(1)
P = 3$
P = 5 – 2Q
0.5$ = 5 – 2Q
0.5 – 5 = -2Q
-4.5÷ -2 = Q
Q = 2.25 glasses
2. P = 2 + 1.5 Q
10 = 2 + 1.5 Q
(10-2) ÷1.5 = Q
Q = 5.3 burgers
P = 2 + 1.5 Q
12 = 2 + 1.5 Q
(12-2)÷1.5 = Q
Q = 6.6 burgers
- Distribute a set of cards from Activity 4, Supply and Demand Cards, to each student and explain the directions as follows:
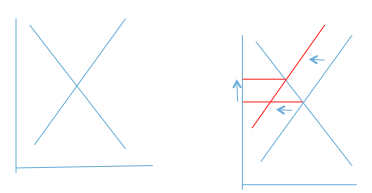
- A scenario will be displayed on a slide. This scenario will influence the supply and/or the demand curve.
- You must choose the card (A-D) that depicts the correct shift(s) of the curve(s) as well as the card (E-H) that shows the change in the equilibrium price and quantity.
- When asked you must show the two cards by raising them above your head.
- Model the procedure by using Slide 8. Show the slide and guide students to choose the correct graph using the reasoning in the table below. Students will now raise both cards. [Dark blue-“D” and pink-“G”]
- Show Slide 9 and encourage students to discuss and reason with a friend to determine the correct cards.
- Students ask pairs to raise their cards and assess by looking at the colors of the cards or the letters in the upper left corner of the card as indicated in the table below. Explain the reasoning to ensure understanding.
- Show Slides 10-12 and allow students to decide which cards to show. Assess the correctness of the responses by observing the colors or the letters of the cards as indicated below. Give the correct answers and explain the reasoning.
Question | Demand or supply card | Price and quantity card | Reason |
1 | Dark Blue “D” | Pink
“G” |
People buy fewer battery operated toys. This will result in decreased demand for these toys. The demand curve will, therefore, shift to the left
Price of the toys will decrease and the quantity exchanged will decrease. Change in taste and preferences. |
2 | Dark Green “B” | Yellow “F” | Wages go up—production costs up –supply decreases—supply graphs shifts left—price increases, quantity decreases
Change in cost of production. |
3 | Light Blue ”C” | White “E” | People buy more iPhones—more sim cards are bought—demand for sim cards increases—demand curve shits right – price increases, quantity increases
Change in the price of a complementary good. |
4 | Light Blue “C” | White “E” | Household gas can be used in place of coal. If the price of coal increases, less coal and more gas will be bought. The demand for gas will increase—the demand curve will shift to the right—price of gas will increase, quantity will increase.
Change in the price of a substitute. |
5 | Light Green “A” | Orange “H” | It is easier and cheaper to trap crabs. The supply of crabs will increase—more crab meat can be canned—the supply of canned crab meat will increase—the supply curve will shift to the right—price will decrease and quantity will increase.
Change in the cost of production. |
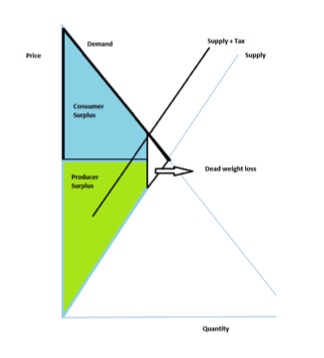
- Distribute Activity 5, Taxation and Dead Weight Loss, one copy per student. Tell students that they will watch a video that explains the effect of a tax imposed on burgers and that they will record some information on Activity 5. Ask them to pay careful attention to the terms “consumer surplus,” “producer surplus,” and “dead weight loss,” which are introduced in the video. Tell students you will pause the video for them to be able to record the information.
- Show the video “Taxation and Dead Weight Loss” available at https://www.khanacademy.org/economics-finance-domain/microeconomics/consumer-producer-surplus/deadweight-loss-tutorial/v/taxation-and-dead-weight-loss
- Pause the video at 1:09 and ask the students to write down the definition of consumer surplus in 1a of Activity 5 and indicate the consumer surplus on the graph in number 2 of Activity 5 by coloring or marking the area. Students share their answers in pairs. Ask a few pairs to share their answers with the class and show their graphs to the class. Students mark and rectify their own answers. Draw the graph on the board and color or mark the consumer surplus. See the graph in step 24. This graph will be used to mark all the other areas. Ask students to define consumer surplus. [A measure of consumer satisfaction, which is calculated by analyzing the difference between what consumers are willing to pay for a good or service relative to the market price of the good or service.]
- Continue showing the video and pause the video at 1:33 and tell the students to write down the definition of producer surplus in 1b of Activity 5 and indicate the producer surplus on the graph by coloring or marking the area. Ask a few individual students to share their answers with the class and to show their graphs to the class. Students mark and rectify their own answers. Color or mark the producer surplus on the graph on the board. See the graph in step 24. Ask the students to define producer surplus. [A measure of producer satisfaction. The difference between the amount that a producer received from the sale of a good or service and the lowest amount that the producer is willing to accept for that good or service.]
- Continue the video and pause the video at 2:22. Tell students to answer question 3 on Activity 5. Ask students why a government would want to tax a good such as hamburgers. [A government wants to tax a good to get more revenue to pay off debts or to invest in capital projects like roads, etc. or to fund poverty relief programs, etc.]
- Continue the video and pause the video at 4:50. Ask students what will happen to the supply curve if hamburgers are taxed. [Supply will decrease and the curve will shift to the left.] Tell the students to draw a “new” supply curve where tax is included. Draw a supply + tax curve on the graph on the board. See the graph in step 24. Students mark or rectify their own work.
- Continue the video and pause the video at 6:22. Tell the students to, in a group of four, discuss and then write down their understanding of “dead weight loss” in number 4 of Activity 5. Each student must also color the dead weight loss on their graphs. Ask groups to define dead weight loss. [Dead weight loss is inefficiency created in a market. It is the part of consumer and producer surplus that is lost because of taxation. The most common reason for dead weight loss is government actions such as taxes or supply controls. Dead weight loss is often illustrated by the use of a diagram that depicts a triangle formed by the demand curve above and the supply curve below and the quantity.] For more background read more: www.businessdictionary.com/definition/deadweight-loss.html#ixzz3L4NKm4BX Color or mark the dead weight loss on the graph on the board. See answer below.
- Ask the students to pay careful attention to what happens when the government imposes a tax of $1 per hamburger. Play the rest of the video and then ask the following questions:
- Who will bear the tax burden, the producer or the consumer? [Both.]
- Will the consumer and producer pay an equal amount of tax? [Answers may differ: yes or no.]
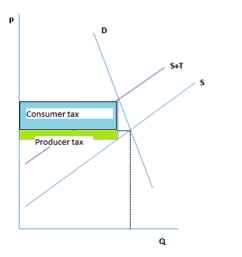
- Draw a graph as in procedure step 24 on the board and explain the tax incidence or the division of a tax burden between buyers and sellers. Stress that the amount of tax paid can be determined by calculating the area of the rectangle in each case.
- Tell students to draw the rectangles to determine the tax incidence in 7A, 7B and 7C in Activity 5. They must also indicate who will bear the bigger tax burden in each case. Draw the graphs on the board as below and allow students to mark their own work.
A.
In this case, the consumer will bear a larger part of the tax burden.
B.
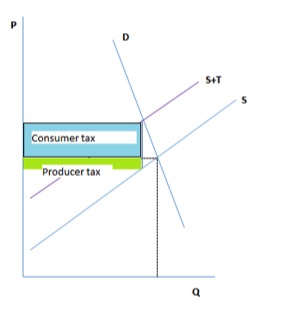
In this case, the consumer will bear a larger part of the tax burden.
C.
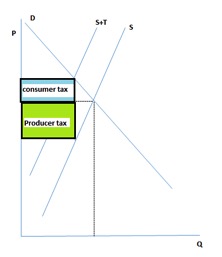
In this case, the consumer will bear a larger part of the tax burden.
- Download the slide show “Tax Incidence” from https://www.stlouisfed.org/education/tax-incidence and store as a Notebook file.SMART Notebook Express software is needed to play the slides and can be downloaded from express.smarttech.com/#
- Tell students that they will be using interactive slides to calculate the consumer and producer tax burdens or tax incidence and the dead weight loss.
- Students will only use slides 2-15 during this activity.
- From slide 5 forward they will be able to complete the graphs by placing letters, titles, and forms in the correct places. They will also be asked to do calculations. (The correct answers are displayed on the subsequent slides.)
- Ask students to solve for the values of x and y and show their calculations in the table below.
Equation |
y |
x |
Calculation |
y = -3 x |
|
2/3 |
y = -3 (2/3) = -2 |
y = 4 x – 6 |
|
-2 | y = 4(-2) – 6 = -14 |
y = 2 x + 3 |
5 |
|
5 = 2 x + 3
5-3 = 2 x 2÷2 = x x = 1 |
- Ask students if they think that taxing hamburgers is a good way to generate revenue and why. [Answers will vary. It is a good way because it will generate some revenue. Most will say it is not because, although it generates some revenue, both the producer and consumer will experience a surplus loss.]
- Ask students, “Who is paying the tax if a tax burden of $2 is placed on a gallon of gas?” [Both the producer and the consumer are paying.]
- Ask students to explain the meaning of dead weight loss. [It is the loss a market experiences when it is inefficient. It is the part of consumer and/or producer surplus lost due to taxation.]
Assessment
Multiple Choice
- What is the function value of the following equation? f(x) = 2/3(x) – 5 if x = 6
- -2(1/2)
- [- 1]
- 1
- 7(1/2)
- Which of the following markets will experience a “dead weight loss”?
- Fresh fruit: the consumers buy and producers sell at prices acceptable for both
- Canned fish: a supplier imported a ship load of cans from Japan
- Candy: consumers are buying less because of health concerns
- [Corn dogs: the government places a tax of $.50 on each corn dog sold.]
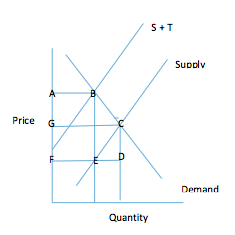
- The “dead weight loss” in the following graph is given by the area
- ABEF
- ABCEF
- [BCE]
- CDE
Constructed Response
You are the newly appointed Head Economist of Super Health Food Industries. Your first task is to evaluate the present situation regarding the supply and demand of one of the company’s most popular products: The X-Factor Apple Sauce.
Presently the price is $3 per bottle of 330 ml and five million bottles are sold per month.
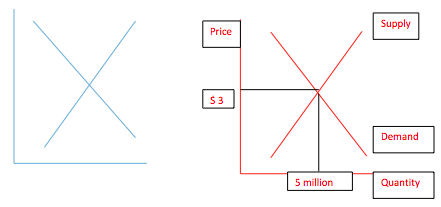
- Use the given Supply and Demand curves. Label the axis and the curves and clearly indicate the price and quantity at equilibrium.
- Due to a storm, the apple crop is much less than during the previous season. This means that the company will not be able to supply five million bottles per month. How will this affect the market? Also, indicate the change on the next graph.
Price will rise, quantity exchanged with fall.
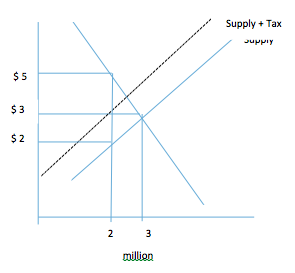
- The government decides to tax the producer of the sauce at $3 per bottle. Use the following graph to calculate the producer and consumer tax burdens and the dead weight loss.
Answer: producer tax burden: 2 million bottles x $1 = $2 million.
½ x (1 million) x $1 = $1/2 million.
The producers’ incidence of this tax is $1 per bottle.
Consumer tax burden: 2 million bottles x $2 = $4 million.
½ x (1 million) x$2 = $1 million.
Consumers’ incidence of this tax is $2 per bottle.
The consumers effectively pay $2 of this tax and the producers effectively pay $1 of the tax per bottle.
Dead weight loss: ½ x $3 x 1 million bottles: $ 1 ½ million.
Related Resources
Grades 9-12
The Great Tulip Boom: Economics in World History
Marginal Revolution University
Grades 9-12
Valentine's Day Demand Interactive
Grades 9-12