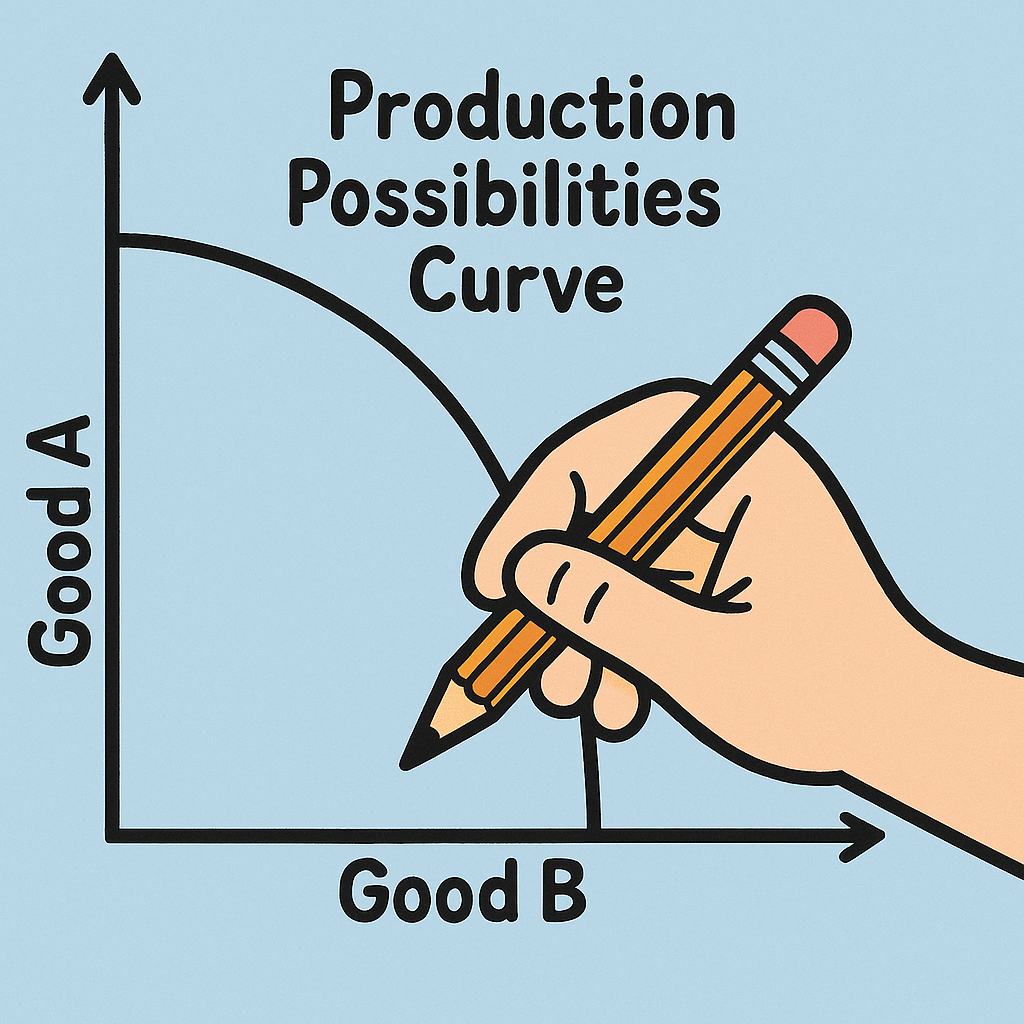
Grade 9-12
,
Lesson

Plotting Potential Production: Hands on with PPC

Time: 45 mins,
Updated: May 29 2025,

Objective

The student will be able to:

  • Explain a production possibilities curve.
  • Explain the impact of scarcity on resource allocation.

In this economics lesson, students will use a production possibilities curve to learn about scarcity and resource allocation.   In groups, they’ll produce two goods, graph their production on a PPC, then use yarn to construct curves based on different scenarios.  Finally, they’ll play “Two Lies and a Truth” to assess what they’ve learned in class about the production possibilities curve.

Resources

For group activity:  10 pieces of paper, 5 markers, 1 scissor per group of 3-5 students

Yarn pieces – about 6-7 inches a piece, yellow, 1 per group.  If you use a different color, be sure to adjust the directions/answers on the slides.

Sets of 1 yellow and 1 red chip per group.   If you use different colors, be sure to adjust the directions/answers on the slides.

Plotting Potential Production Slides

PPC String Graph Student Handout

Production Possibilities Worksheet

Production Possibilities Worksheet Answers

Visual – Example of Graph with Yarn and Chips


Procedure

Lesson Prep

Production Activity – Slides 2 – 6

Place students in groups of 3 – 5.  Give each group 10 pieces of paper, 5 markers, and 1 pair of scissors.  Groups will have 10 minutes to make as many bookmarks and posters as they can with the available resources.  They need to make a combination of both products. And they must be decorated in some way – not just words on the page. (Product criteria: posters = a full 8 ½ x 11 page; bookmarks = 5 per 8 ½ x 11 sheet.) After the 10 minutes are up, groups will share the number of products they made (teacher can record group responses on the board for later referral)  Groups will explain their choices as to resources allocation.

Here are some suggestions for poster/bookmark sayings:

  • “Opportunity Cost: Skipping Netflix to Study Economics”
  • “Talk to the Invisible Hand”
  • “Scarcity: the Reason There’s No Pizza Left”
  • “Money Talks. Mine Mostly Says Goodbye”
  • “Make Good Choices: Consider the Costs and Benefits”

Debrief questions: Why did you decide on the number of bookmarks vs. posters? Did you use all of your available resources? If yes, is one group’s production more efficient than another? If no, why did you not use all available resources?

Have each group graph the different production possibilities on a PPC graph with one axis labeled bookmarks and the other axis labeled posters. Have them brainstorm how many posters they would make if they were just making posters, and how many bookmarks they would make if they were just making bookmarks.  Graph the three points (only posters, posters and bookmarks, only bookmarks) and draw the curve that connects the three points.  If a group used all of their resources, their production will be recorded as a dot on the PPC curve. Teacher note:  If they have 10 pieces of paper,  the max they would make are 10 Posters and 0 Bookmarks,  40 Bookmarks and 0 Posters, and the third number is their actual production.  So their graph should be labeled to 40 on bookmark axis and 10 on poster axis.

Student Questions:

  • What would happen if your group was given more resources – more markers, more paper, more workers?   (You would increase production at all points) What would happen to your productivity?  What would that look like on your graph?  What would happen to the curve?
  • What would happen if one of your group members couldn’t work?  (Production would decrease at all points). What would happen to your productivity?  What would that look like on your graph?  What would happen to the curve?


Group Practice – Slides 6 – 12

Say to students: “Now let’s practice using the PPC.”  Hand out the PPC graph with yarn and dot markers or chips.  The lesson uses dot markers that are red on one side and yellow on the other side.  The red side marks where the economy begins and the yellow side signifies where the economy ended.  The yarn indicates where the new PPC curve is. (If the teacher doesn’t have two sided dot markers, two different colored sheets of paper can be cut into circles and used instead).  See Example of Graph with Yarn and Chips

Do the 1st scenario together as a class. See Slides 6-12.  First read the scenario to the students and give them time to solve it.  Check it as a class by drawing the correct graph on the board.  After ensuring the students understand what to do, read the other scenarios one by one to the class.  Check the students answers upon completion of each scenario and correct any misunderstanding. Answers are in the slide notes.

ADDITIONAL PRACTICE QUESTIONS – Not on slides but here if you need more reinforcement or want to use the questions on a quiz or test.

 During a period of rising tensions, a country redirects resources from consumer goods to military equipment production.  The country was at full employment.

  •  ANSWER:  Red dot on curve; yellow dot on curve closer to capital; PPC curve does not shift

The country is in a recession but a nationwide education reform program is introduced and it increases worker skills and productivity, allowing more output with the same inputs.

  • ANSWER:  red dot below curve, yellow dot on curve; PPC shift outward


Individual practice/Homework

Hand out the Production Possibilities Worksheet.  Students complete this worksheet individually for a grade. Production Possibilities Worksheet Answers


Exit Slip/Cool Down

2 Lies and a Tuth. After reading the scenario, the students determine which statement is the truth and explain why. Slides 13 – 16.  Answers in slide notes.

Review concepts on Slide 17.

Subjects:
Economics