Sign in with Google

Grades 9-12
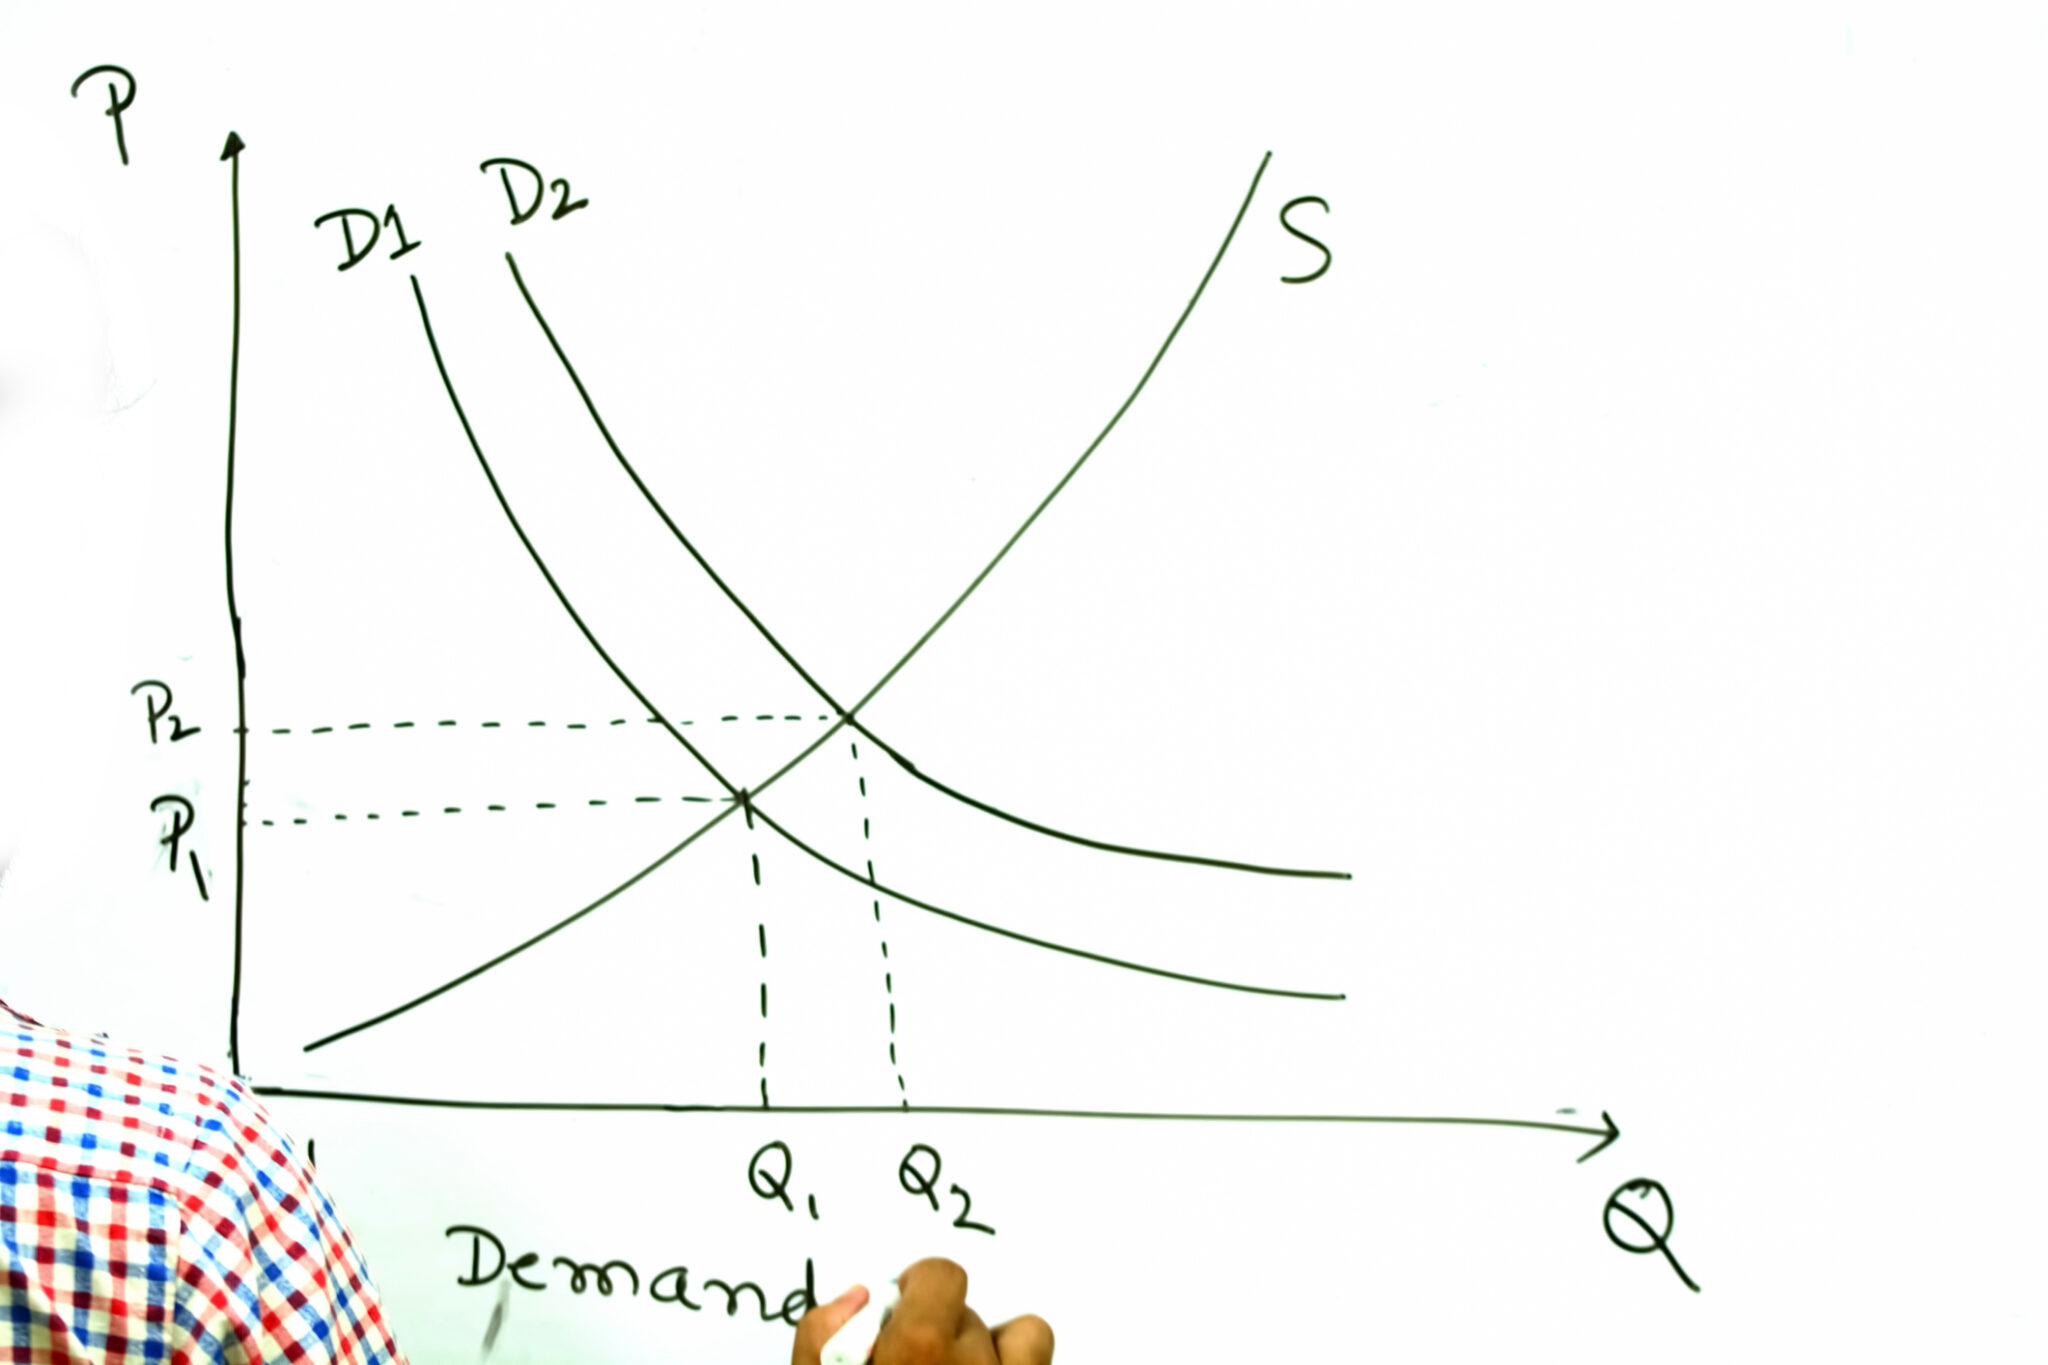
Stringing Together Supply and Demand: A Tactile Approach to Graphing
In this economics lesson, students use a yarn manipulative activity to accurately illustrate changes in supply and demand curves while...
Key Concepts: AP Macroeconomics, AP Microeconomics, Basic Economic Concepts…